Column chart
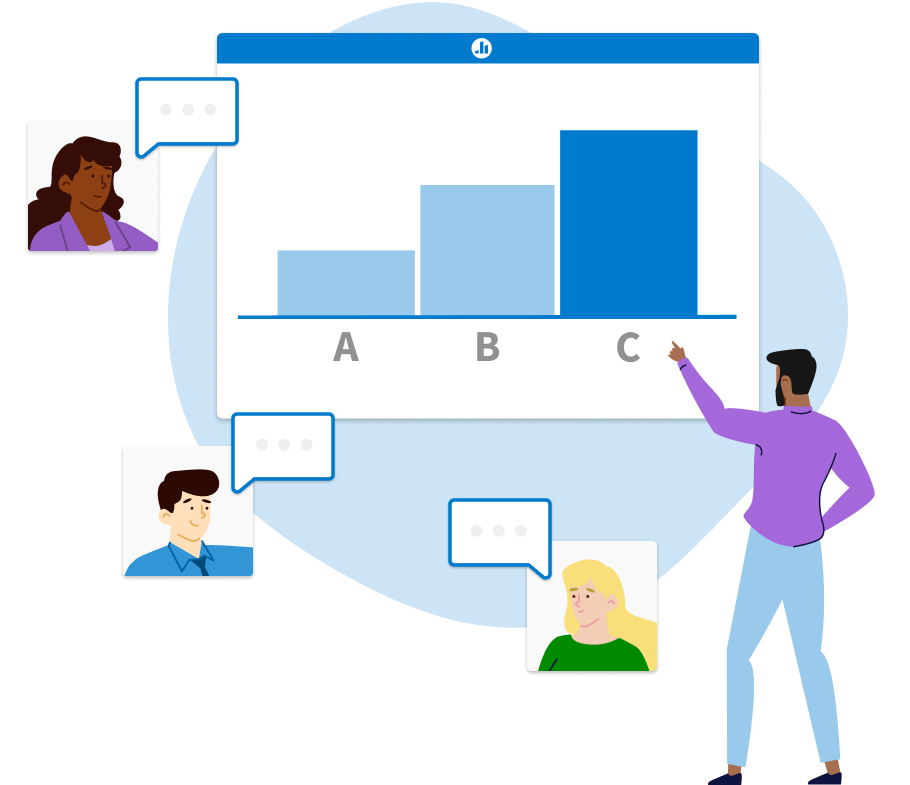
Compare responses side-by-side in a classic column chart
More types of activities

Project feedback
Gather feedback on a project and prioritize the most relevant entries so you can address what matters.

Check-in with your team
As workers transition to a remote environment, use this opportunity to check-in with your team about what they're doing to stay sane and motivated.

Pre-training survey
Gauge your trainees’ motivations by gathering feedback on what they expect from the training.