We re-imagined Poll Everywhere reporting tools to give you more of what you want: Measurable engagement, organized grading, and easy-to-read data.
The rebuilt reports make it easier than ever to measure the effects of your polls in a live presentation. Here are a few of the key changes:
- Thumbnails of each poll chart, so you can see all your results at a glance
- Engagement widget helps you measure audience interaction from poll to poll, or across the session.
- Quickly access archived results of several polls in one report.
A couple of examples of the new (and very good-looking) reports:
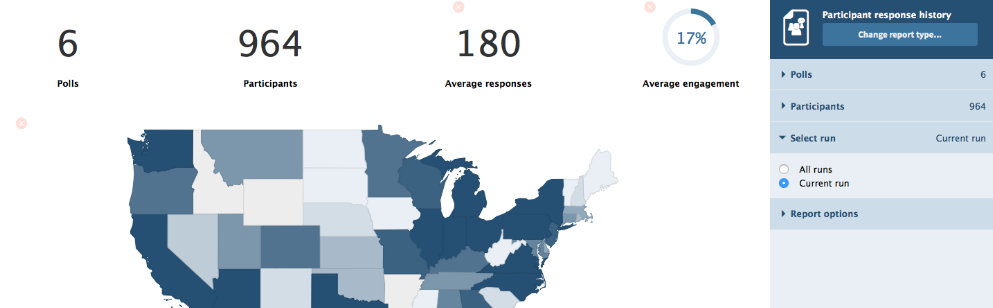
 Executive summary
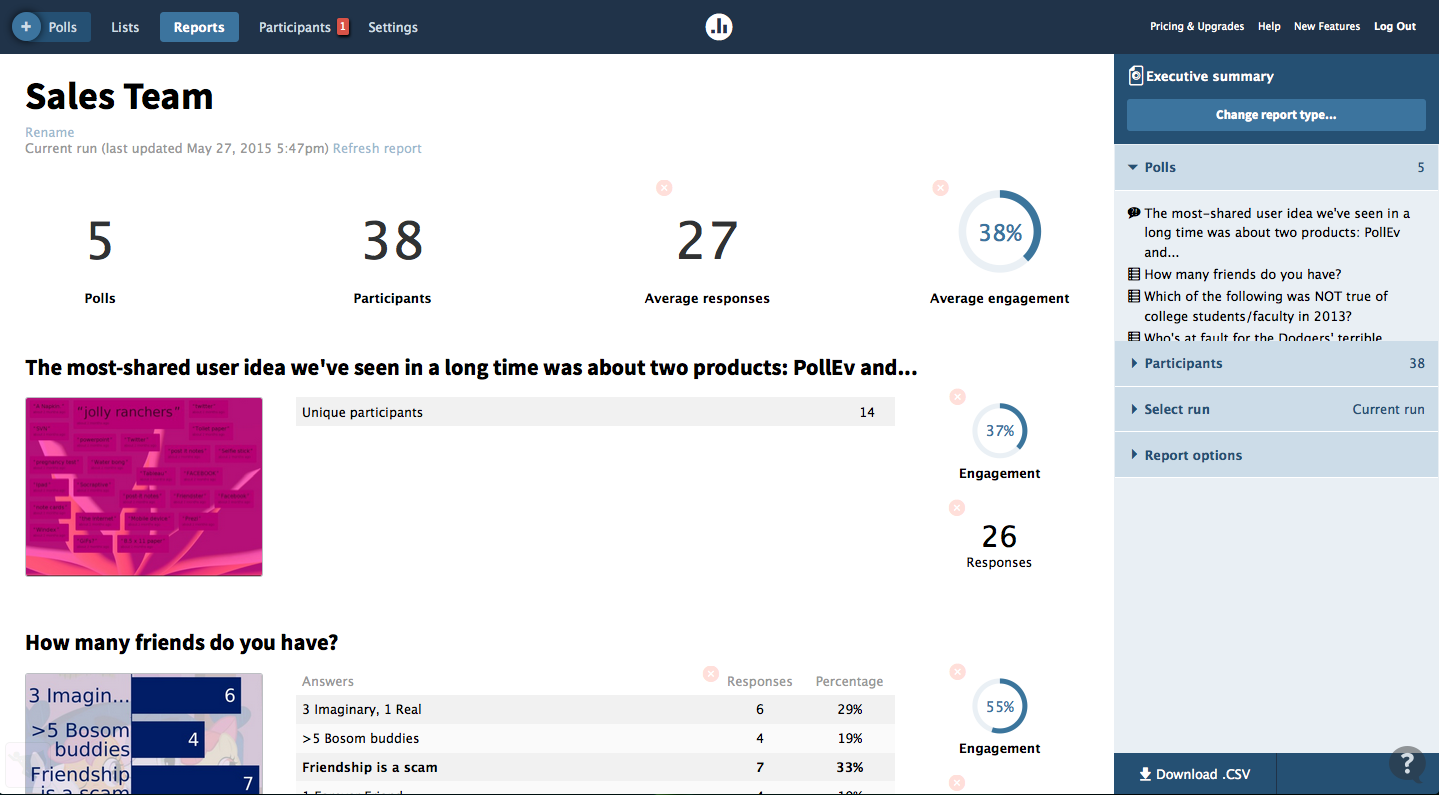
The executive summary report offers a big picture view of overall engagement and responses to your polls, including thumbnails of each poll chart for easy reference.
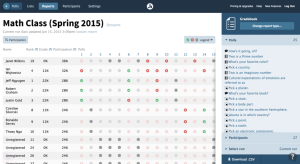 Gradebook

The gradebook shows educators and corporate trainers correct/incorrect responses, ranking, and class participation, all in one handy chart.
Take a peek at all the new reporting tools, and then try creating a few reports of your own.
P.S. Don’t forget to keep an eye on Twitter for links to reporting articles. We’ll be updating often with posts on all the new reporting tools and how to use them.